BouncePoints™

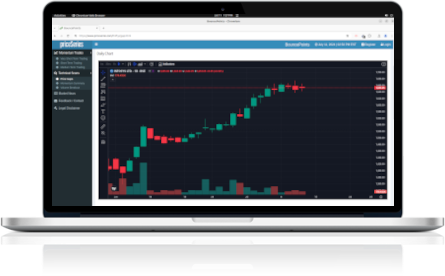
 Investor Targeting Using Technical Analysis
BouncePoints™ Service leverages technical analysis to help companies target investors effectively by using signals like moving averages, breakouts, and RSI levels. This approach allows companies to identify optimal entry points and time their outreach to match favorable market conditions, attracting institutional investors, fund managers, and family offices aligned with stock growth trends.
 priceSeries Investor Database
priceSeries provides access to a comprehensive investor database, including institutional investors, fund managers, and family offices. Clients can use this database or integrate with their in-house lists for customized targeting. With this combination of technical analysis and an investor database, BouncePoints™ helps companies refine investor engagement and drive capital inflows at critical moments.
 BouncePoints™ Alerts
BouncePoints™ Alerts is a cutting-edge service providing daily updates on competitor stock movements, investment activities, and market trends. Stay informed about your competitor's financial landscape to make smarter strategic decisions and target investors during key market shifts.
- Daily Competitor Alerts: Get updates on stock movements, institutional holdings, fund purchases, and sales of competitor shares.
- Investment Change Tracking: Track when major investors adjust their positions in competitor stocks for actionable insights.
- Actionable Insights: Analyze industry trends and identify opportunities when key investors enter or exit competitor positions.
How BouncePoints™ Empowers Smaller Companies to Attract Investors?
BouncePoints™ is revolutionizing the way smaller companies compete for investment by providing cutting-edge tools that deliver real-time insights and targeted strategies. By closely monitoring competitor activities and market trends, BouncePoints™ enhances visibility among top investors, positioning smaller firms as compelling choices in a crowded market.
With access to a robust investor database, smaller companies can strategically target investors whose interests align with their industry and growth trajectory. BouncePoints™ employs technical analysis to pinpoint favorable stock conditions, allowing companies to time their outreach perfectly to capture investor interest.
Moreover, by tracking competitor stock movements, BouncePoints™ helps smaller companies engage with investors actively seeking new opportunities after trading competitor shares. Our daily alerts ensure that smaller firms stay proactive in communicating timely updates, thereby building trust and credibility with potential investors.
By harnessing this data-driven approach, BouncePoints™ equips smaller companies to overcome their visibility and resource challenges, empowering them to compete more effectively and attract vital investment.
With this data-driven, strategic approach, BouncePoints™ empowers smaller companies to overcome visibility and resource limitations, making them more competitive in attracting investment.
priceSeries Investor Database

More than
500 Family-office investors

More than
7000 Investment Bankers

More than
5000 Fund Managers
Why priceSeries?
priceSeries is a technical analysis company that helps investors navigate complex and volatile financial markets. Here are a few reasons why you may choose us:
Strong R&D & Technical Expertise: priceSeries invests heavily in R&D to stay ahead of market trends and to refine our algorithms. Our R&D has enabled us to develop a platform that applies the latest algorithms and techniques, ensuring that our analysis is highly accurate.
priceSeries brings its trusted technical analysis and tools to empower clients to make well-informed, strategic financial decisions.
Data-Driven Insights: priceSeries utilizes research-driven methodologies to interpret vast amounts of market data. By grounding our insights in statistical models and market-tested theories, developed and refined through our R&D, we provide clients with precise, data-backed information for informed decision-making.
Real-Time Analysis Alerts: Our platform provides advanced monitoring and alert systems that provide real-time updates to our clients. This helps businesses stay responsive to market changes, offering them a competitive edge in quickly adapting to new opportunities or risks.
Risk Management: With a focus on R&D, priceSeries offers advanced and custom-designed risk assessment tools that anticipate market shifts. Our research helps to predict critical support and resistance levels in advance, equipping businesses to manage risk proactively.
Customized Strategies: priceSeries R&D allows specific or niche areas for technical analysis. We deliver tailored insights that align with a company's unique goals. Our research-driven approach ensures that strategies are highly relevant and reflect the latest market dynamics.
Started in 2015 priceSeries has invested in continuous R&D and technical analysis tools. We are well-positioned to provide businesses with reliable insights and innovative tools that support strategic decision-making and enhance overall market performance. A few of our press mentions and industry awards are listed below: