W&T Offshore, Inc. Trade Analysis by priceSeries
W&T Offshore, Inc., Trade AnalysisFull Trade Animation Day by Day Analysis | |
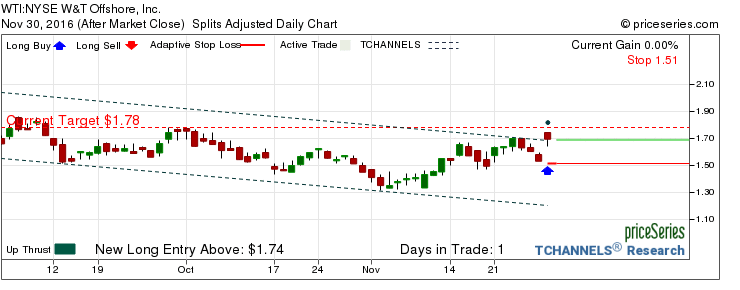 |
Day 1System identifies the trade, shown by Blue up arrow. |
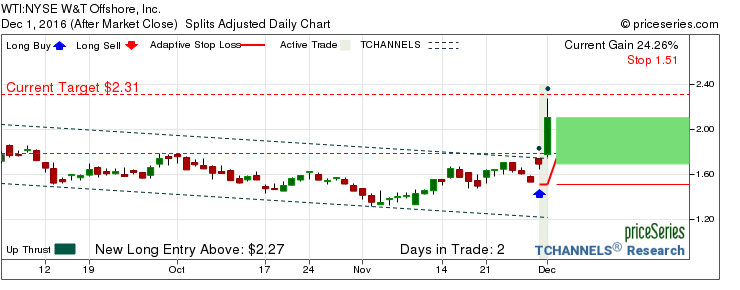 |
Day 2Very positive price action. |
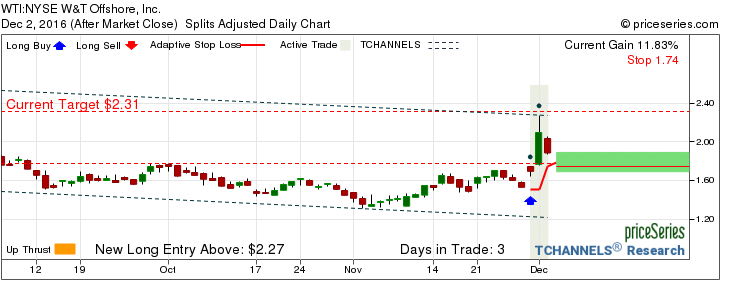 |
Day 3Another day with meek price aaction. |
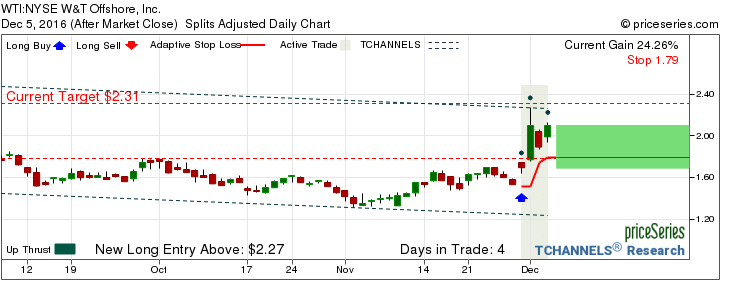 |
Day 4Positive price action. |
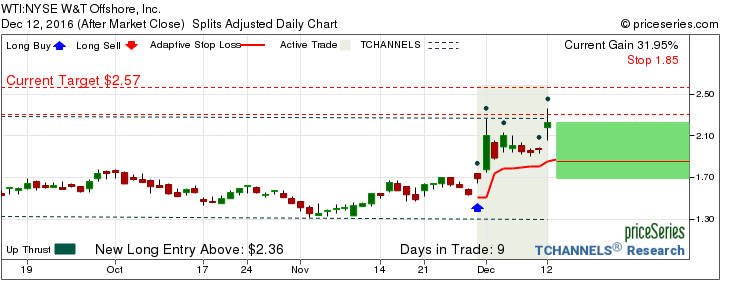 |
Day 9TCHANNELS® and resistence breakout. |
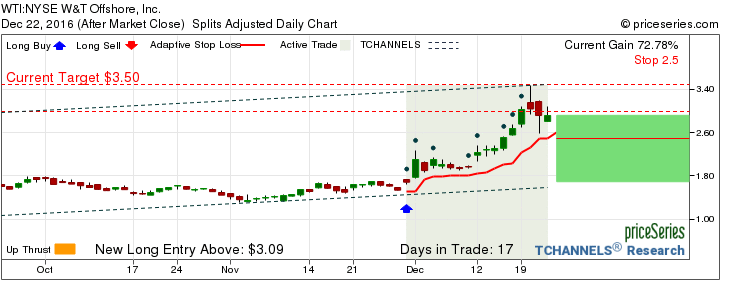 |
Day 17The prices seem to be receding from the resistence level |
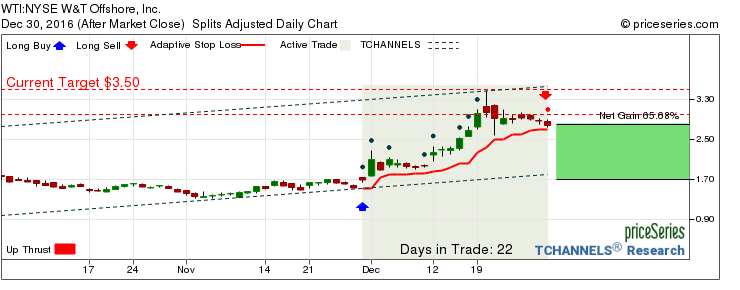 |
Day 22Trade exit on Stop Loss. |

